
Sekonic Profiles:
The following profiles, source files, and training material is offered free of charge and with no warranty or guarantees expressed or implied. It is my hope that everything provided here will be a useful resource to you as you set out to use your light meter during pre-production and on set. I am continuing to update the profiles and information here as I have access to cameras and continue my testing and research.
Ryan is a featured cinematographer on Sekonic’s Learn From The Pros Interviews.
Content:
- Important Notices (Updated 09/18/13)
- Get Updates
- Sekonic Camera Profiles (Updated 08/21/13)
- Tutorial Videos
- Best Practices (Updated 10/12/12)
- FAQ (Updated 03/13/13)
- Creating Profiles For Log / RAW
Important Notice: (09/18/13)
- The profiles below can be used in ANY of the Sekonic meters that are compatible with the DTS software. As of this writing that includes the 758 & 478 line of meters. (More may come in the future.)
- It appears that the bug that I original wrote about has been fixed with version 3.06 of the DTS software. If you upgrade to the latest version, you should be able to create a calibrated profile.
Profile Charts:
Exposure Profile Target
Exposure Profile Target II (Recommended)
X-Rite Color Checker
Sekonic Software: (DTS)
Data Transfer Software and USB Driver
Sekonic Meters:
(What I use & recommend)L-758CINE-U DigitalMaster Light Meter
LiteMaster Pro L-478D-U Light Meter & 5 Degree Spot Viewfinder for Litemaster Pro L-478D, L-478DR Lightmeter
(Read This Post to figure out which meter will better fit your needs.)
Important Disclaimer About Dynamic Range:
The charts listed above, which are used to create these profiles, are printed charts. As such, they are inherently limited in the dynamic range that they can reproduce. When they are exposed at multiple exposure levels they can be used to create a profile for use with the light meter. I have found them to be more than adequate in pursuing this goal. These charts are not intended as definitive, or comparative tests for dynamic range. To truly test dynamic range on a precise technical level, please use a transmissive chart like the Stouffer T4110 Chart, DSC Labs Xyla, or the Arri Dynamic Range Chart.
Sekonic 758Cine & 478d Profiles
(For use with DTS version 3): (08/21/13 - all profiles updated with v 3.06 of DTS)Please read the READ ME FIRST document that is in each of these downloads. This document contains important information specific to each camera that is helpful for understanding and using the profile and the original source files.
Best Practices On Using These Profiles & How To Work With Log / Raw Cameras Can Be Found After Tutorial & The Definition Section Below.
Please test and modify these profiles to suit your needs and tastes. What works for me, may not suit your style of metering or desired results. The DTS software allows for ultimate flexibility in adjusting every part of the profiles I’ve created. I have also provided the source files so that you can create your own profiles from scratch. I have detailed how to calibrate your meter while using these camera files / profiles in the FAQ section below.
Arri Cameras: (Created with the 758Cine)
Alexa (Cooke Panchro /i 75mm T2.8) [Log C]
(Download from Indie Cinema Academy Sekonic Page)
Blackmagic Design: (Created with the 758Cine & 478D)
Cinema Camera EF Mount (Cooke Varotal 20-100mm T3.1) [Film / RAW]
(Download from Indie Cinema Academy Sekonic Page)
Canon Cameras: (Created with the 758Cine & 478D)
C100 (Rokinon 85mm 1.5) [Canon Log, FilmConvert 5207, 2393 LUT]
(Download from Indie Cinema Academy Sekonic Page)
C300 (Canon 50mm 1.2L) [Canon Log, EOS, and 6 Custom Profiles]
(Download from Indie Cinema Academy Sekonic Page)
5D MKIII (Canon 35mm 1.4L) [Neutral] - THIS IS FOR VIDEO MODE ONLY (Created with the 478D)
(Download from Indie Cinema Academy Sekonic Page)
5D MKII (Canon 35mm 1.4L) [Neutral & CineStyle] - THIS IS FOR VIDEO MODE ONLY (Created with the 758Cine)
(Download from Indie Cinema Academy Sekonic Page)
Panasonic Cameras: (Created with the 758Cine)
AF100 (Cooke Panchro /i 32mm T2.8) [Ryan’s Custom Cine-D]
(Download from Indie Cinema Academy Sekonic Page)
GH2 (Cooke Panchro /i 32mm T2.8) [Driftwood Hack using Smooth & Nostalgic] - THIS IS FOR VIDEO MODE ONLY
(Download from Indie Cinema Academy Sekonic Page)
Red Cameras: (Created with the 758Cine)
Epic / Scarlet (Cooke Panchro /i 32mm T2.8) [RedLogFilm]
(Download from Indie Cinema Academy Sekonic Page)
(The Epic & Scarlet use the same sensor; the only difference currently is the feature set. This profile is based off of the base sensor without any HDRx)
Sony Cameras: (Created with the 758Cine)
F65 (Zeiss Ultra Prime 85mm T1.9) [S-Log] - Thanks to Tal Lazar & American Film Institute Conservatory for providing the files.
(Download from Indie Cinema Academy Sekonic Page)
How Do I Use The Profiles?
If you are wondering how you use these profiles after you have them loaded into your meter, I’ve put together THIS BLOG POST that covers just that.
Tutorial Videos:
Important Best Practices & How To Work With Log / Raw Cameras Can Be Found After The Definition Section Below.
Definitions (As referenced in the tutorial video above):
White Balance
Expressed in degrees kelvin, this is the color temperature that the camera is set at in order to render white (and all other colors) properly. (From a more technical perspective, white balance has two scales, the blue to orange scale which is expressed in Kelvin and referred to as color temperature, and the magenta to green scale which is referred to as color correction).
Shutter Angle
Expressed in degrees, this is the opening/setting of the shutter. Shutter speed may also be used, however, a conversion from speed to angle will need to be done to be able to input the data into the Sekonic software when in cine mode. The equations to make the conversions are as follows:
Speed to Angles: (Frame Rate x 360) / Time Fraction = Angle. EXAMPLE: 1/48 speed @ 24 fps = (24 x 360) / 48 = 180 angle
Angles to Speed: (Frame Rate x 360) / Angle = 1/Speed. EXAMPLE: 180 angle @ 30 fps = (30 x 360) / 180 = 1/60
Shooting Frame Rate
This is the frame rate that the video file is being recorded at. Through adjusting the shooting frame rate either up or down, (under or over cranking), high speed and slow motion recording happens. Changing the shooting frame rate also changes the amount of light that is recorded due to the increase or decrease of the exposure time.
Project Frame Rate
This is the base or viewing frame rate of the video file. Common project, or base frame rates are 23.98, 24, 25, 29.97, and 59.98. It is the project frame rate that determines how fast or slow the recorded image will be viewed. For example, if you recorded a video file at 48 frames a second, and the project/base frame rate was 23.98, then it would play back two times slower than it was recorded. If the project/base frame rate was 29.97, then it will play back 1.6 times slower.
Aperture
Expressed in F-stops or T-Stops, this is the iris opening of the lens.
Exposure Index (EI)
The speed, or the rating given to a recording format. It represents the sensitivity to light of a given format. The terms ASA and ISO have been more commonly used, however, those terms are more associated with film. And when the same assumptions from film ASA/ISO get applied to digital, mistakes can happen in exposure and in placing the exposure range. So I am using the term EI to differentiate from the assumptions associated with film as these profiles have been created for use solely with digital cameras.
Profile Settings
Any specially settings applied through camera menus, LUTS, or any other parameter that can be adjusted in a digital camera that is not covered by one of the other settings.
Lens
The make and model of a particular lens.
Clip Number
The file name or shot number in the sequence of shots made to complete the profiling process.
Exposure Value (EV)
Where a particular exposure falls in relation to the other exposures. 1 EV = 1 Stop. A change of 1 EV may happen through any parameter change: Aperture, Shutter, Shooting Frame Rate, EI, Light Levels, or ND. EV is a term more commonly used in photography then in cinematography where we use the term “stop”.
Best Practices: (10/12/2012)
5 handy tips to use with you 758Cine, 758DR, and 478D.
I have outline 5 handy tips that you can use to get more out of your meter: Highlight Priority Mode, Changing The Trigger Position in Spot Mode, Determining Contrast Ratios, Determining Dynamic Range Of A Scene, & Finding The Middle Tone Value of a Scene on THIS BLOG POST. While the steps I have outlined are specific to the 758Cine, they also apply to the 758DR, and can be used with the 478D as well. (Except for changing the trigger Position.)
Using the 5 degree spot meter of the 478 verses the 1 degree spot meter of the 758.
The 5 degree meter of the 478 is never going to be as precise as the 758, that is just a function of the wider filed of view. However, here are some things that I do to help myself get more precise spot readings with the 478: (I will continue to update this as I work with the meter more.)
1. Meter uniform objects.
If the object that you are spot metering has many tonal values to it, the meter will be taking all of those values and averaging them together. So it is important that whatever you are spot metering is evenly lit.
2. Fill the viewfinder / target.
Just spot metering a uniformly lit object is not enough with the 5 degree spot meter, it has to also fill the viewfinder / target area. If it doesn’t fill the target area as you look through the spot meter, then the reading will be influenced by the other objects in the target area.
The DTS software is conservative when creating custom profiles.
The DTS software creates its profiles by processing 8 bit images and evaluating the clipping points based on default values inherent in the program. These default values are conservative and may not fully represent the capabilities of the camera you are profiling.
The default values use by the software are as follows (8 bit numbers):
Dynamic Range (+) = 245
Clipping Point (+) = 230
Mid. Tone = 118
Clipping Point (-) = 35
Dynamic Range (-) = 20
These values may or may not be the full / minimum saturation points of your camera system. The best way to evaluate if these are the correct values, is to evaluate the Exposure Profile Target II on a waveform and then find their 8 bit values using a program like Photoshop. If the values match the DTS software, then you do not need to change anything. If they do not match, then you need to change them before creating your profile. Detailed instructions on how to do this are below in the section on creating a profile for a log based camera.
Adjusting The Dynamic Range & Clipping Points In DTS v3.0.
The dynamic range and clipping points are independently adjustable in the incident and reflected mode within each EI value. So if you make changes in one area be sure to update it in all other areas otherwise you will not have access to the modified data in the other modes. For example, let’s say you created a profile that covered EI 800 and EI 400. If you decreased the highlight dynamic range point in the spot (reflected) mode on EI 800, that change will NOT be reflected in the incident mode, nor will it be reflected at EI 400. To adjust the point for the reflected mode, you need to choose the Measuring Mode drop down menu (Left hand side of the screen) from Incident to Reflected. Repeat this process for EI 400. Once complete, save your profile and load it into the meter. Now all of your changes will be reflected for all modes and all EI’s.
Incident And Reflected Readings.
The DTS software offers just about infinite control of the creation of your camera profile. This is a good thing if you know about it, and are aware of what is going on. Practically, what this means is that you can create a profile that accurately maps the cameras response across all of its’ EIs. Which is very important to be able to do with digital cameras as many of them do not have an equal response at all EIs. I noted in the tip above that changes in one mode and EI do not automatically update in other modes and EIs. The same is true with the profile as a whole. If you shoot your chart at EI 800, your camera profile will only be reflected when using that EI within that profile. (In both incident and spot mode). If you change EI’s within your profile, it will not automatically update/translate those numbers to the new EI. If you are going to use multiple EI’s with your camera system and meter I have the following recommendations: 1. Shoot and process the chart for all of the EIs that you will be using. (Best & most accurate option). 2. Only use your camera at the EI you have created the profile for (Simplest & easiest option). 3. Copy the results from one EI to all the other EI’s by manually inputting the values using the Manual Input Mode (Takes more time, and may not be accurate at untested EIs).
The Urban Legend of 18% Grey, and the reason for creating custom profiles.
18% Grey, and default IRE values may not be as helpful to us now that we are in the digital age of cinematography. Check out my write up on The Urban Legend of 18% Grey and what to do about it for a more in-depth look at the issue. The short answer, and the best practice that I recommend, is to use the Exposure Profile Chart and your meter to create and map the exposure range of your camera system to the meter. Once you have your profile, you can modify it to fit your needs and preferences for exposure, so that you can get consistent, predictable results every time. As you’ll see below, even the tried and true method of IRE values can cause some confusion ...
Using Multiple Profiles, or Hey, Why Do I Get Different Readings With Different Profiles?
One of the “fun” realities with digital camera systems are all of the options that are given to the end user to adjust the image. Digital cameras also map mid tone to different IRE levels. Add on top of that your personal preference of where you place your mid tone level on the IRE scale, and it all adds up to a large number of variables that will effect the out come of a particular exposure and camera profile combination. Unfortunately, nothing is quite as straight forward as you might think with digital cameras. “Proper” IRE value for mid tone is a floating target, and can fall anywhere around 35 IRE up to 55 IRE. This is why if you are using my custom profiles from above for non-log / raw cameras you may be getting readings that vary from 1/2 - 1 stop between camera profiles. Gamma curves as well as the ability to shoot in Log all effect the outcome of where mid tone falls. For example, Sony recommends that when using their S-Log, mid tone should fall at an IRE of 38. But when shooting in Rec 709, that value should be 50. There are other Sony cameras that set mid tone to 40 or 45. (See why this is so much “fun”.) This is not unique to Sony. Here are a couple of waveforms from other cameras to illustrate the point: (Download all of the waveforms from the cameras I have profiled here.)
Log Based Camera: Epic-X @ ISO 800 using RedLogFilm - Mid Tone = about 39 IRE
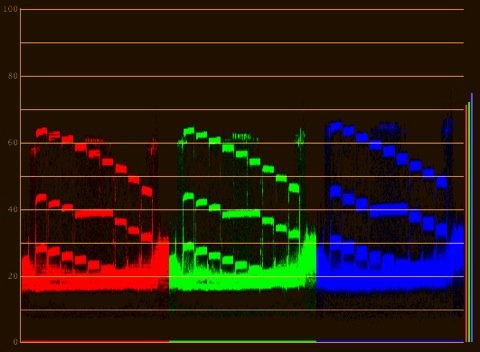
Non-Log Based Camera: GH2 with the Neutral Profile @ ISO 640 - Mid Tone = about 58 IRE
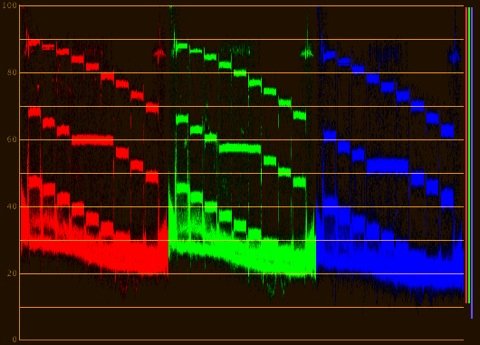
Quite a difference! There are three options you have for processing this information:
1. You can accept the different levels and just move forward.
This is the simplest and easiest way to approach this problem. In practice, I have found this to work well most of the time, as long as I am not using two non raw / log camera on a production that have a huge difference in where they place mid tone. (The AF100 and the 5D are about 10 IRE different for example, whereas the GH2 and the 5D are only about 5 IRE different.) If I am using multiple camera systems and the differences are greater then what I would like, then I have to use one of the following methods:
2. You can decide that a given IRE is what all cameras should deliver mid tone at (like 40 or 50), and change your exposure accordingly until you reach that level.
I would not recommend this option unless you have done your own testing to see if you are ok with the results. If the results work for your application, use it. Just be warned that as you change your exposure levels, you are effecting the under and over exposure range of your camera system. For example, if you camera places mid tone at 40 IRE and you choose to place it at 50 IRE, you will be loosing about 1 stop of dynamic range in the highlights. The opposite is also true, if your camera places mid tone at 60 IRE and you want it at 50 IRE, you will be gaining about 1/2 of a stop in the highlights. (See the charts above and count the steps. Each step equals 1/6 of one stop. The long step in the center is mid tone.) Always test and verify - don’t just take my word for it. :)
3. You can modify your custom meter profile so that all of the profiles line up and match exposure level.
This is one of the things I appreciate about the DTS software, you can customize your profile as you see fit. To line all of the profiles up, you will need to follow the same steps that I have outlined below in the Creating Profiles For Log / Raw Recording Cameras. This process is different then what I’ve outlined in option 02 above. In option 02, you are shifting the relationship of where the mid tone falls to the highlights and the shadows. In this option, what you are doing is telling the software where to find mid tone, the highlights, and the shadow values and then the software is mapping it accordingly. So the resulting profile keeps the same relationship between everything. However, I still recommend testing this method out, as I have not experimented with it on an actual multi camera shoot with different formats. So you will want to test and confirm these results for yourself prior to an actual shoot. (I have done the work for you in creating these profiles for the non-Log / Raw cameras. They are the profiles ending in MOD within the each Profile download file.)
If you want to explore this issue on a more technical level, check out my blog post The Urban Legend of 18% Grey.
Frequently Asked Questions: (12/17/2012)
Why doesn’t my meter display T-Stops? Doesn’t that make it less precise?
The short answer is no it doesn’t, for all practical purposes F-Stop is equal to T-Stop. If your lens has T-Stop markings on it, use them, and if it has F-Stop markings, use those. If it has both markings, then use the T-Stop markings.
Here is the long answer:
F-Stop, is short for focal ratio. What this number represents is the relationship between the lens’s focal length and the diameter of the aperture. It is a purely mathematical relationship. Lenses were designed before light meters, and so when light meters first came out they used the common vocabulary of F-Stops. This was very helpful for photographers, where pictures are viewed independently from one other, and not in succession. However, as the motion picture industry grew, it became apparent that not all lens designs were equal. Each lens element, and the different coatings used in the design all absorb light. Depending on how a lens is made, it may or may not be transmitting the same amount of light as another lens at the same F-Stop reading. These differences will lead to changes in exposure as lens are swapped out on a camera system. Because motion pictures are a collection of successive images, they need to have the same exposure from shot to shot, otherwise the exposure differences can be visually jarring to an audience. There needed to be a standard measurement for the amount of light that was transmitted by a lens, and thus the invention of the T-Stop.
The T-Stop, is the precise measurement of the amount of light that passes through the lens and ends up on the recording medium (film or digital). If you take a prime lens that has a T-Stop of 2.8 and then change to a zoom lens that also has a T-Stop of 2.8 you know that you will be getting the same exposure, as both lenses have been measured, and tested to deliver the same amount of light at that aperture setting. No compensations or adjustments needs to be done by the cinematographer.
While it might be nice if the light meter displayed readings in T-Stops to help avoid some confusion, it is technically impossible for the meter to read out in T-Stops as that is a transmission value - it is confusing two different measurement scales. For the meter to do that, it would need to be physically mounted to a lens, as the light meter has no way of knowing what lens you are using, and how much light is being transmitted by that lens. If you want to be sure that your recording medium is receiving the proper amount of exposure that the meter reading is giving you, and that it will match exposure with other lenses, then you need to use the T-Stop markings on your lens. If you use the F-stop markings, it is possible to have exposure fluctuations between shots.
If all of your lenses are in F-Stop readings, and you do not have the option of T-Stops, then you can create individual custom profiles for all of your lenses using the process I have outlined in my tutorial videos on profile creation with the DTS Software. (See above) While this will yield the most accurate profiles for use with your system, I personally find it easier and simpler to use one set of lenses from a manufacturer with T-stops, as I know they have already been calibrated correctly. (With the lens set at T2.8, I know that my camera is seeing the F2.8 value of light that my meter is telling me I need.)
How can I ensure that my meter is calibrated if I am using one of the profiles available on this site?
For the DTS software to calibrate your meter, you need to give it two measurements at the start of profile creation process. You will need to give it the incident and spot readings your meter gives you when you meter the Exposure Profile Target II. To do this, setup the chart and light it to the exposure value that I have noted in the READ ME file in the profile download. (This will most likely be either T4, T5.6, or T8.) Be sure that the chart is lit to within 1/10 of a stop from edge to edge. (If you are unsure of how to do this, watch my tutorial video to learn how.) Once the chart is lit, take a spot measurement of the center chip, and then take an incident reading at the center of the chart. With these two values, you can now use the files that I have provided to create a custom profile that will also calibrate your meter.
Do I HAVE to calibrate my meter to the profile I downloaded from the site?
No you do not, as long as you are comfortable with variances of 1/10 - 3/10 of a stop. If you want the maximum precision, then yes, you have to go the extra step. For more on this, read my blog post.
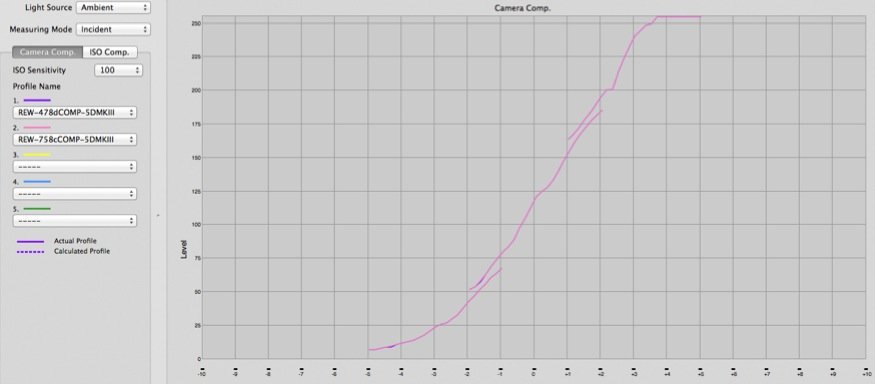
Can I use a profile created on a different meter, with my meter? (I have the 478d, but the profile was created with the 758c.)
Yes, you can. I haven’t experienced any issues with doing so. In fact, I even ran a test to see if there would be any differences between profiles when a different model was used, and as you can see from the chart below, the two profiles line up exactly. So be sure to follow the steps outlined above for calibrating your meter, and you will be all set to use any of the profiles on this site. You can download the two profiles I created for this test to see for yourself if you would like. :)
The Canon C300 says ISO 850 and my meter says ISO 800, what should I do?
The simple answer is to not worry about it and use ISO 800 on your meter, you’ll be fine.
The longer answer is that through my talks with Canon, the reason that they chose the rating of ISO 850 was purely a technical choice. When the engineers set about evaluating the camera, the precise technical measurement they arrived at was ISO 850. While I’m sure this is great for Canon to know and market, in the real world, ISO 850 doesn’t exist, and it is of no real value to us cinematographers as the 50 point difference doesn’t amount to a noticeable change in exposure. Here is the math: From ISO 800 to ISO 1000 it is an increase of 1/3 of a stop, or 200 points. From 200 I divide by 50, giving me 4. I take the 1/3 of a stop difference (ISO 800 VS ISO 1000) and divide that by 4. That equals about 1/10 of a stop (0.0833). For the overwhelming majority of people (I’d guess 99%) no one can see a difference in exposure of less then 1/3 of a stop, let alone a difference of 1/10 of a stop. 1/3 of stop, also typically falls within most peoples margin of error which results from different metering techniques. Furthermore, cinema lenses, which have more markings then DSLR lenses, are only marked in increments of 1/3 of a stop. If you can find a set of lenses that you use regularly on set, that will let you set exposure at markings 1/10 of a stop, I will be very impressed. So don’t sweat the 850 VS 800 difference on the C300. (Besides, that thumbprint you accidentally put on the lens, will probably equalize that out …) ;)
Why should I create and use a custom profile, can’t I just use the default profile?
Creating custom profile for you meter accomplish two things that I think will greatly help you when using your meter. The first thing that custom profiling does is that it calibrates your meter*. It makes the Incident and the Spot meter line up in exposure readings. With the default profile, you may notice that your exposure readings between the two modes may be off by anywhere from 1/4 - 1/2 of a stop. (This may or may not be an issue for you. It is an issue for me.) The second, and more important reason why I think it is beneficial to create a custom profile is that you will be able to accurately display the exposure range of the camera on the meter. When you use a default profile, the outer arrows that mark the dynamic range of the camera are useless until a profile is created. Since digital cameras change so much these days, and with their exposure range can shift depending on the EI selected, I find it quicker and easier to create a profile, and have that profile remember all of the specific details and nuances for me. And that allows me to focus on the bigger issues, like creating the mood through lighting, rather then memorizing a bunch of technical details.
*Having a calibrated meter should not be over looked. I appreciate that I can calibrate my meter in the field instead of having to spend a lot of time waiting as I send the meter back to the factory for calibration. Creating a custom profile does just that. If you are finding that the meter is off by large amounts when using a default profile, then you most likely have a defective meter, and you may want to contact Sekonic as it probably needs to be looked at. I have tested my 3 year old 758c against a factory fresh 758c and their readings were identical.
Why do you use EV’s instead of Stops; isn’t that confusing?
Yep, it is confusing. :) This meter, (758Cine) and the support material came from a photography background, and EV’s are a common term in photography. Because of this, the meter displays ratios and other values in EV’s and the manual references EV’s as well. So in order to try and mitigate as much confusion as possible, I have adopted the term EV for use with these tutorials. I didn’t want to speak in our common terminology of stops and then have you go to the manual only to get lost as the manual only references EV’s. :)
When do I use the Normal Mode and when do I use the Extended Mode? And what exposures do I need?
Normal Mode is used with camera systems capable of recording 10 stops of dynamic range or less. You will use this mode with the following exposures: 0 EV, & +/- 3 EV. Extended mode is used with camera systems capable of recording 10 - 20 stops of dynamic range. You will use the following exposures: 0 EV, +/- 4 EV, & +/- 8 EV.
Why do I need to take 7 exposures*? Can’t I just take the 3, or 5 I need?
Taking all seven exposures* will cover your bases for the complete range of your camera system. Unless you know for certain that the camera you are profiling has a dynamic range of less than 10 stops, then I recommend taking all seven exposures. You have gone to the effort and time of setting up the chart, you may as well add the extra couple of minutes that it will take to shoot the 4 additional exposures. That way you can be sure of the limits of your camera system. Additionally, if you think that your camera has over 10 stops of dynamic range, and it really has less (or vise versa), then you will have all of the exposures you need to profile it correctly.
*The 0 EV exposure is used in both modes, so you only need to take it once. If you want to be extra diligent, you can take the 0 EV exposure twice, otherwise, just copy /duplicate the 0 EV exposure to use in both the extended and normal modes.
How do I reset the meter to the default profiles?
The meter can be set back to the default profiles in one of two ways:
With The Computer-
1. Connect the meter to the computer via the USB cable an turn on the meter.
2. Launch the DTS v3 software.
3. Go to Options > Reset Light Meter To Defaults
4. Power off the meter and disconnect from the computer.
With The 758Cine Meter-
1. Make sure the meter is off.
2. Press and hold the AVE / EV button while you press the power button. (You have now entered the manual custom profile mode in the meter.)
3. Simultaneously press the Mode button and the Memory Clear button. (This clears the memory for all of the camera profiles.)
4. Turn the meter off to leave the manual custom profile mode.
How do I reset the meter to the factory default (ALL settings will be erased and restored)?
With The 478D Meter-
1. Make sure the meter is off.
2. Hold down the MENU button and press the POWER button.
3. Select FACTORY SETTINGS, and press YES both times it appears.
With The 758Cine Meter-
1. Make sure the meter is off.
2. Press and hold the M. CLEAR button and then press the POWER button. “F.5” appears on the screen.
3. Press the MODE and the “AVE/EV button at the same time. All of the icons on the LCD will appear, and then it will automatically turn off. (It is now reset.)
How do I create a profile for a film camera?
1. Follow the steps I have outlined in the tutorial above for creating a profile for a digital camera.
2. Processing the film, and have it telecined by a company like Cinelicious.
3. Once your film has been digitized, use the DTS software to create a profile.
Creating Profiles for Log / Raw Recording Cameras:
What Is Log?
In very simplified terms, log recording of video files is a way of storing and compressing the video file at a reduced file size/bit depth while distributing the values perceptually. Pragmatically, what this results in is a file that is very flat looking (low in contrast) that contains all of (or the vast majority of) the information in the highlights and in the shadows. It is the most efficient way to retain as much information in the video file without actually working with the completely raw file. It also allows for a recorded image that is well suited for color grading. (This is a very simplified answer, if you are interested in the technical details/specifics there are many more resources online that will take you into greater depth. Articles on ProLost are a good place to start).
How Does Log Effect Profiling?
Log recording can have a significant impact on the creation of the camera profiles with DTS* if you are not aware of what is going on. The biggest impact that log recording can have in the creation of a camera profile is in the skewing of the mid tone value as seen by the software. This is why I recommend double checking your log based camera profile against a default profile to see if you need to modify the profile within DTS. The best way to do this is to create your camera profile and export it out to the meter. (Be sure to leave one of the camera profiles blank/at its default values). Now, using the profile you created, set the EI to the EI that the profile was created for and take an incident reading. (If your chart was set at EI 800, set your meter to EI 800). Next change the camera profile to a blank profile. (Press and hold the ISO1 button, and then press the MID. TONE button). As you change back and forth between camera profiles, notice the readings, if they change more than a half of a stop, then I would suggest that you need to adjust your values within DTS.
*Unfortunately there is no standard for Log based files, each camera manufacturer maps the recorded values to their own predetermined values. Furthermore, some “log” recordings are not true log recordings, but just emulate a log recording. The CineStyle picture profile would be a good example of a profile that emulates a log recording. So while I would love it if there were a standard setting that the DTS software could be put at for all Log based cameras, that is not going to happen. Camera manufacturers these days cannot even put their lens mounts at standard lens heights, so it might be asking too much to ask for a standard log recording ...
How Do I Create A Profile Using Log?
1. Determine if your profile needs to be adjusted.
Before going to the extra work of modifying your camera profile, first check to see if it really does need to be adjusted or not. Follow my recommendations for testing the profile that I outline in “How Does Log Effect Profiling?” (Above).
2. Determine the highlight dynamic range, highlight clipping point, shadow clipping point, and shadow dynamic range.
Bring the footage you shot into your NLE or grading application of choice. It is important that whatever application you choose has the ability to accurately read and display a waveform. Once the footage is imported into your application, load it and make note of all of the limits based on the readings from the waveform. Below are screen grabs from Color in which I have loaded the ProRes footage from my Alexa test. I have also made notes about the choices I have made in regards to the limits I have chosen.
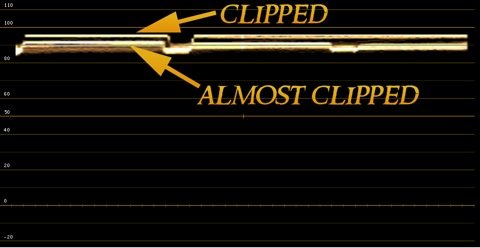
The waveform reading from the +8 EV chart zoomed in to see the third from the bottom left chip along with the center chip (+8 EV) and the +8 1/6 EV above it. The Almost Clipped chip pictured above is close enough to being completely clipped that I have chosen this chip as the highlight dynamic range chip that will be used to create my profile. On this chart, this chip represents an EV of +7 as it is 6 chips down from the center chip. On this chart, I can tell that there is still about another 1/3 of stop of absolute dynamic range here, but pragmatically, these values are so close to the absolute clipping point, that they will be graded together in post. So I am choosing not to count them.
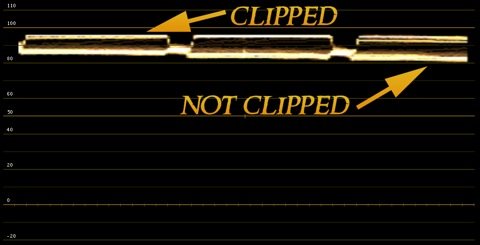
The waveform reading from the +8 EV chart zoomed in to see the first from the bottom right chip along with the three chips above it (+7 5/6, +7 4/6, + 7 3/6 EV’s). The Not Clipped chip is about 10 IRE down from the chip I chose for my dynamic range limit chip. This is a great enough change for me to mark it as the clipping point. It is at this value that I will know that I am getting close to clipping. If I need important detail to remain in the image, I will want to keep it at or below this value. On this chart, that chip represents an EV of +6 as it is 12 chips down from the center chip.
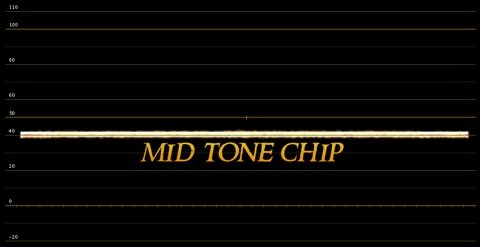
The waveform reading from the 0 EV chart zoomed in to see the center chip. As you can see here, the chip is falling at a value of 40 IRE. This is my first clue that if I use the default log profile as created by DTS, I may be off in my readings. The software is looking for a mid tone value of closer to 50 IRE, or somewhere around a value of 118 on an 8 bit RGB scale of 0 - 255.
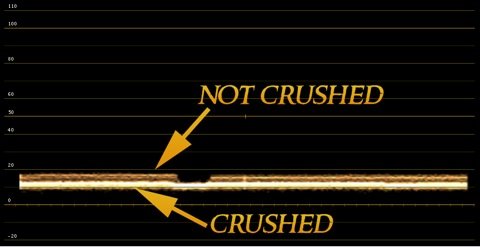
The waveform reading from the -4 EV chart zoomed in to see the third from the bottom left chip along with the -3 5/6 chip and center chip (-4 EV). As you can see here, the Crushed chip is actually just barely above the no detail point. When I look at this chip on my monitor I can still clearly see it, so there is still information here. I have chosen to use this chip as my shadow clipping point as I’ll use it to mark where I need to keep important shadow detail at or above to ensure proper texture detail. On this chart, that chip represents an EV of -5 as it is 6 chips down from the center chip.
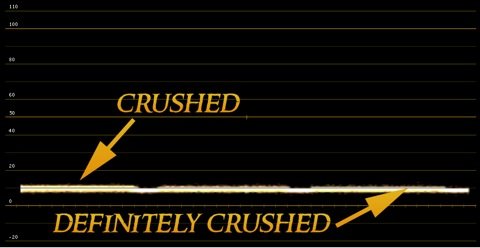
The waveform reading from the -8 EV chart zoomed in to see the first from the top left chip along with the -7 3/6, -7 4/6, & -7 5/6 EV chips. As you can see here, the Crushed chip is actually just ever so barely above the Definitely Crushed chip. When I look at this chip on my monitor I can still see it and a couple of chips past it, so there is still information here. But practically speaking, in the grade all of this detail will be graded together, so the safer call is to go with the previous chip. On this chart, that chip represents an EV of -6 as it is 12 chips up from the center chip. Now when I create my profile, I know that the values between -5 and -6 are not very great - there is a good chance that they will be graded together. However, on screen there is enough of a visual difference to me that if I need to, I can dig out detail between these two points in the grade. (Unlike with the chips that follow the -6 chip).
3. Determine the 8 bit RGB averages for the selected chips.
Now that I have selected the chips that I want to use as my limit points, I open up the footage in Photoshop. Once it is open, use the selection tool to take a sample of the chip. As I do this I take note of Median values that display in the histogram tab. If these values are not displaying for you go to WINDOW > INFO or press F8 to display this window, and make sure you have an area selected with the selection tool.
For the chips referenced above, here are the 8 bit RGB averages / median values I used:
Highlight DR Limit: 235 (+7 chip on the +8 EV exposure)
Highlight Clip: 210 (+6 chip on the +8 EV exposure)
Middle Tone: 107 (0 chip on the 0 EV exposure)
Shadow Clip: 30 (-5 chip on the -4 EV exposure)
Shadow DR Limit: 25 (-6 chip on the -8 EV exposure)
4. Change the default values within DTS.
Now that I have the values I need to use for my profile, I need to use them to create my profile in the software. Before creating the profile, I go to OPTIONS > DYNAMIC RANGE / CLIPPING POINT DEFAULT VALUES. A window will drop down at this point and you can change all of the default values. I take the averages I noted in the previous step and input them in the boxes to the right, and the click OK when I am done.
[Be sure to change the values back to their defaults when you create another/different profile, otherwise you will skew the results for your other cameras].
5. Now create the profile using the standard procedure as outlined in the video above.
Follow the standard method for creating a profile. This time when I create the profile, I should not get a warning that the set levels do not exist in the image.
6. Retest your profile.
Load my profile and a blank profile into the meter and compare. These two readings should now be very close. They may vary by 1/10 - 2/10 of a stop, but not by any amount that would cause a significant exposure error (1/2 stop or more).
7. Light and expose with confidence.
Now that I have a properly calibrated meter as well as a camera profile, I can go out and confidently light and exposure my images. Enjoy!